 by
by What is fatty liver disease and why does it matter?
Fatty liver disease describes the accumulation of excess fat in liver cells. When more than 5 % of the liver’s weight is fat, the condition is called hepatic steatosis. It can appear as non‑alcoholic fatty liver disease (NAFLD) in people who drink little or no alcohol, or as alcoholic fatty liver disease in heavy drinkers. The non‑alcoholic form is far more common; estimates suggest it affects up to 30 % of adults in many countries.
Most people with early fatty liver feel fine. Over time, however, fat‑laden hepatocytes become inflamed, scar tissue forms, and the disease can progress to non‑alcoholic steatohepatitis (NASH), cirrhosis, or liver cancer. Because the liver handles glucose, fats, and toxins, its impairment has system‑wide consequences, especially for heart disease and type 2 diabetes.
How does insulin normally work?
Insulin is a hormone released by the pancreas after a meal. Its primary tasks are:
- Promote glucose uptake into muscle and fat cells.
- Stimulate the liver to store glucose as glycogen.
- Inhibit the liver’s production of new glucose (gluconeogenesis).
- Facilitate the synthesis of fatty acids when excess calories are present.
In a healthy person, insulin’s signals are transmitted efficiently. Liver cells (hepatocytes) respond by balancing glucose storage with glucose release, and by regulating the amount of fat they synthesize or export.
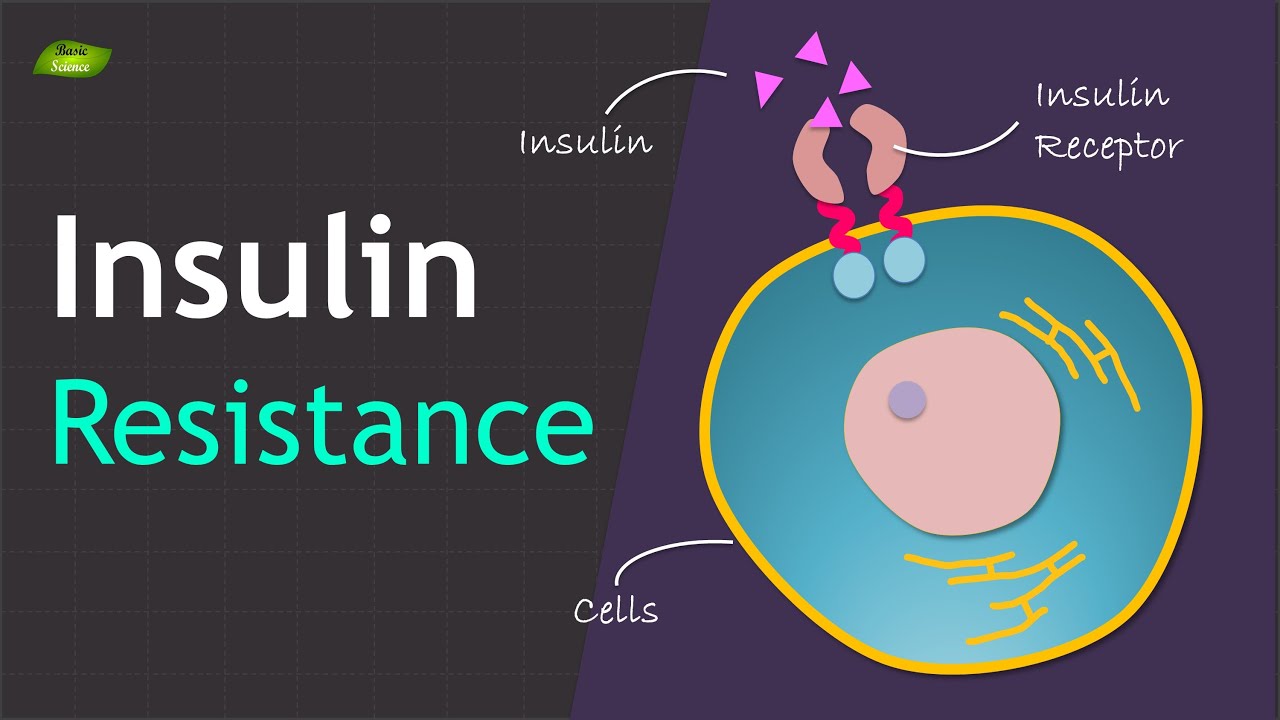
What is insulin resistance and how is it measured?
Insulin resistance (IR) occurs when target cells require more insulin to achieve the same metabolic effect. The pancreas compensates by producing higher insulin levels, leading to hyperinsulinemia. Clinically, IR is inferred from:
- Elevated fasting insulin or C‑peptide levels.
- Impaired fasting glucose (100–125 mg/dL) or a 2‑hour oral glucose tolerance test result above 140 mg/dL.
- Homeostatic Model Assessment of Insulin Resistance (HOMA‑IR) scores; values above 2.5 are commonly considered resistant.
Because a single test cannot capture the whole picture, clinicians usually assess a combination of laboratory results, body‑mass index (BMI), waist circumference, and family history.
Why insulin resistance drives fat accumulation in the liver
The link between IR and hepatic fat is biochemical rather than coincidental. Several mechanisms converge:
1. Increased delivery of free fatty acids (FFAs) to the liver
In insulin‑sensitive adipose tissue, insulin suppresses lipolysis, limiting the release of FFAs into the bloodstream. When adipocytes become resistant, this brake fails. The result is a constant flood of FFAs that travel to the liver, where they are either oxidized for energy or re‑esterified into triglycerides.
2. De‑novo lipogenesis (DNL) is up‑regulated
Insulin normally promotes DNL only when carbohydrate intake exceeds immediate energy needs. In the insulin‑resistant state, hyperinsulinemia persists despite high glucose, and the liver interprets the signal as “abundant fuel.” Key enzymes—acetyl‑CoA carboxylase (ACC) and fatty‑acid synthase (FAS)—remain active, converting excess carbohydrates into fatty acids that are stored as triglycerides.
3. Impaired β‑oxidation
Insulin resistance blunts the liver’s ability to burn fatty acids through mitochondrial β‑oxidation. Factors such as reduced activity of carnitine palmitoyl‑transferase 1 (CPT‑1) and accumulation of toxic lipid intermediates (diacylglycerol, ceramides) inhibit the oxidation pathway. When supply outpaces disposal, triglycerides pile up.
4. Hepatic insulin signaling paradox
Insulin resistance does not affect all liver pathways equally. While the insulin‑driven suppression of gluconeogenesis becomes blunted, the lipogenic arm of the insulin signal remains relatively intact. This “selective insulin resistance” creates a situation where glucose production continues unchecked, yet fat synthesis proceeds aggressively.
Clinical evidence tying insulin resistance to fatty liver
Large epidemiological studies consistently show that measures of IR predict the presence and severity of NAFLD, independent of body weight. For example:
- In a cohort of 2,000 adults, each unit increase in HOMA‑IR raised the odds of having hepatic steatosis by roughly 30 %.
- Longitudinal data reveal that people with high fasting insulin levels are more likely to progress from simple steatosis to NASH over a five‑year period.
- Interventions that improve insulin sensitivity—such as weight loss, metformin, or GLP‑1 receptor agonists—often reduce liver fat content even when total caloric intake remains unchanged.
How other risk factors intersect with insulin resistance
Insulin resistance is not the only driver of fatty liver, but it interacts with several common risk factors.
Obesity and visceral adiposity
Excess abdominal fat is a reservoir of metabolically active adipocytes that are prone to insulin resistance. The larger the waist circumference, the greater the FFA flux to the liver.
Dietary patterns
High intake of refined carbohydrates and fructose overwhelms hepatic DNL pathways. Fructose bypasses the normal insulin‑regulated steps of glycolysis, feeding directly into lipogenesis.
Sedentary lifestyle
Physical inactivity reduces muscle glucose uptake, forcing the liver to compensate with higher insulin output. Exercise also boosts mitochondrial capacity, helping the liver oxidize fatty acids.
Genetics
Variants in genes such as PNPLA3 and TM6SF2 increase susceptibility to steatosis. These genetic factors can amplify the effect of insulin resistance, making some individuals develop fatty liver at lower body‑mass indexes.
Diagnosing fatty liver in the context of insulin resistance
Effective diagnosis combines biochemical, imaging, and occasionally histologic tools.
- Blood tests: Elevated alanine aminotransferase (ALT) and aspartate aminotransferase (AST) may hint at liver injury, but normal values do not rule out steatosis.
- Imaging: Ultrasound is widely used for initial detection; it identifies echogenic changes characteristic of fat. Controlled attenuation parameter (CAP) on FibroScan and magnetic resonance imaging‑proton density fat fraction (MRI‑PDFF) provide quantitative estimates.
- Liver biopsy: Reserved for cases where the distinction between simple steatosis and NASH is crucial. Histology can also grade fibrosis.
When insulin resistance is suspected, clinicians often order fasting insulin, HOMA‑IR, or a 2‑hour glucose tolerance test alongside liver assessment. The combined picture guides treatment intensity.
Therapeutic approaches that target insulin resistance
Because IR sits at the crossroads of metabolism, improving insulin sensitivity directly attacks the root cause of fatty liver.
Lifestyle modification
- Weight loss: A 5‑10 % reduction in body weight can lower hepatic fat by 30‑50 %.
- Physical activity: 150 minutes of moderate aerobic exercise per week improves muscle insulin uptake and reduces liver fat independent of weight loss.
- Diet quality: Emphasizing whole foods, reducing added sugars, and incorporating omega‑3 fatty acids help blunt DNL.
Pharmacologic options
- Metformin: Primarily reduces hepatic gluconeogenesis; modest effects on liver fat, more pronounced when combined with lifestyle change.
- Pioglitazone: A thiazolidinedione that enhances peripheral insulin sensitivity; several trials show significant reduction in steatosis and inflammation.
- GLP‑1 receptor agonists: Promote weight loss and improve IR; recent data indicate notable decreases in liver fat measured by MRI‑PDFF.
- SGLT2 inhibitors: Lower glucose reabsorption in kidneys; emerging evidence suggests a secondary benefit on hepatic fat content.
Emerging therapies
Research is exploring agents that directly inhibit key steps in DNL (e.g., ACC inhibitors) or that enhance fatty‑acid oxidation (e.g., PPAR‑α agonists). These strategies aim to break the cycle of selective insulin resistance.
Practical steps for someone who suspects they have fatty liver
- Check basic metabolic labs: fasting glucose, HbA1c, fasting insulin, lipid panel, ALT/AST.
- Calculate HOMA‑IR if insulin is available; a value above 2.5 warrants closer follow‑up.
- Schedule an abdominal ultrasound or FibroScan for a visual assessment of liver fat.
- Adopt a structured plan:
- Aim for 5‑10 % weight loss if overweight.
- Incorporate 30 minutes of brisk walking or equivalent most days.
- Replace sugary drinks with water; limit processed carbs.
- If lifestyle change is insufficient after three to six months, discuss pharmacologic options with a healthcare provider.
How reversing insulin resistance improves liver health
When insulin sensitivity improves, several favorable shifts occur:
- Adipose tissue regains its ability to suppress lipolysis, lowering the FFA influx to the liver.
- Hyperinsulinemia fades, reducing the inappropriate activation of DNL.
- Mitochondrial function in hepatocytes recovers, enhancing β‑oxidation of fatty acids.
- Selective insulin resistance resolves; the liver’s glucose output normalizes while lipogenesis slows.
Clinical studies show that a 7‑10 % weight loss can halve liver fat, and that sustained improvement in HOMA‑IR correlates with lower fibrosis scores. In other words, fixing insulin resistance not only clears fat but also curtails the inflammatory cascade that leads to scarring.
Key take‑aways
Insulin resistance is central to fatty liver disease because it creates a metabolic environment in which excess calories are shunted into the liver as fat, while the liver’s ability to burn that fat is compromised. The condition is measurable, treatable, and often reversible with a combination of lifestyle changes and, when needed, medication. Understanding the insulin‑liver link empowers patients and clinicians to intervene early, before simple steatosis evolves into irreversible liver damage.